Dashboard
Your Dashboard will be launched automatically after login. If you’d prefer not to have it launch automatically then this can be altered by clicking on the tick box. You can resume the automatic launching of the Dashboard and choose your launch page via the User Options.
The Dashboard can also be launched via the Application menu, Information Board option, or from the quick access toolbar, Information Board option.
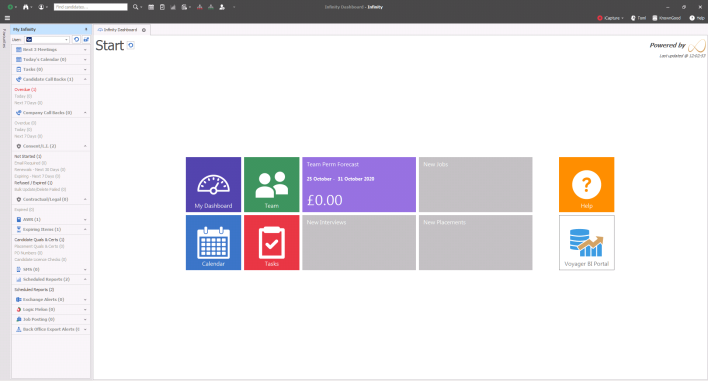
The Dashboard Start screen displays a selection of tiles, both static and animated.
You can refresh the Dashboard contents at any time using the  Refresh Button and the last updated information is also displayed
  . You can alter the number of minutes between refreshes via the User Options which is covered later.

My Dashboard
This tile launches the user’s own Dashboard, displaying charts, gauges and data that relates to the logged in user.
 Calendar
This tile launches the user’s Calendar in a new tab window, the Dashboard remains open in a separate tab.

Tasks
This tile launches the user's Task list in a new tab window, the dashboard remains open in a separate tab.

Help
This tile launches the Help
 Voyager BI
This tile launches Voyager Business Intelligence reporting tool (DBManager permission level required to access and setup content)
Choosing your Dashboard Start Screen
In User Options you can select from 3 different Team Dashboard options; Team, Company or None (My Targets).
 Team
Team
This tile launches the Team Dashboard, displaying charts, gauges and data that relates to the Team that the logged in user belongs to.
|
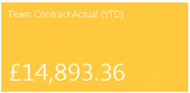
Team Revenue [animated]The animated tile displays Actual, Forecast and Pipeline charge figures for the Team that the logged in user belongs to.
|
|
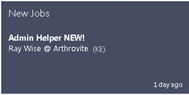
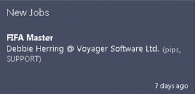
New Jobs [animated]The animated tile displays new Jobs added by users within the Team. The tile displays summary information on the Job, such as Job Title, Company, Contact and Consultant. Click on the tile to go to the related Job page which opens in a new tab window, the Dashboard remains open in a separate tab. |
|
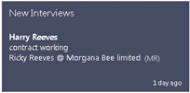
New Interviews [animated]The animated tile displays new Interviews added by users within the Team. The tile displays summary information on the Interview, such as Job Title, Company, Contact and Consultant. Click on the tile to go to the related Interview page which opens in a new tab window, the Dashboard remains open in a separate tab.
|
|
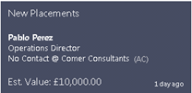
New Placements [animated]The animated tile displays new Placements added by users within the Team. The tile displays summary information on the Placement, such as successful Candidate, Job Title, Company, Contact, Consultant and estimated value. Click on the tile to go to the related Placement page which opens in a new tab window, the Dashboard remains open in a separate tab.
|
The differences between the Team and Company Dashboard tiles are:
 Company
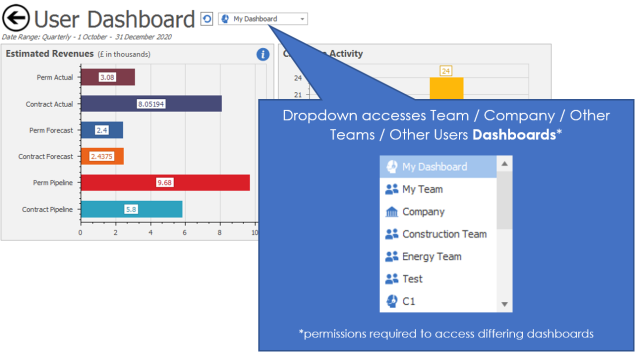
This tile launches the Company Dashboard, displaying charts, gauges and data that relates to the whole Company.

You are able to use the dropdown list to view other users' or teams' dashboards, whether you are in your own or the team dashboard. This requires permission to access this area; please speak to your system administrator for more details.
 The differences between the Team and My Targets Dashboard tiles are:
My Targets
This tile displays information for the user regarding individual targets and ratios.
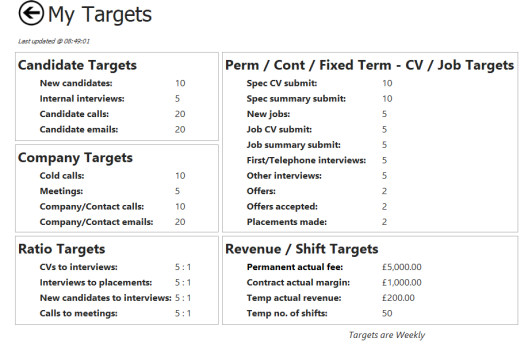
- This screen displays the individual activity targets and ratios for the logged in user.
- It also shows Revenue Value targets.
- This tile is only available in the Dashboard Type “My Targets”.
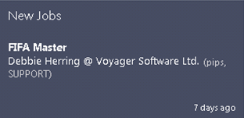
These animated tiles display new Jobs, Interviews and Placements added by the logged in user only.
The tile displays summary information on the Job, Interview and Placement as per the team dashboard.
Click on the tile to go to the related page which opens in a new tab window, the Dashboard remains open in a separate tab.

|
Use the arrow to return to the Dashboard Start page. Date Range parameters are displayed (Weekly / Monthly / Quarterly) and can be configured in User Options. As targets per and dashboard view can be mixed up, eg weekly targets set and user views monthly dashboard the target conversion rates are done as follows:
Note - Dashboard reports all figures in base currency and does not do any currency conversions. |
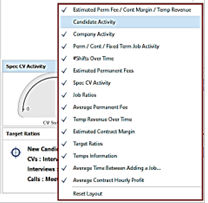
Select which widgets appear on the Dashboard
|
Each chart is a widget
|
|
|
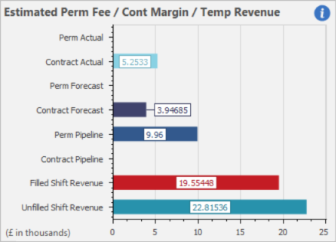
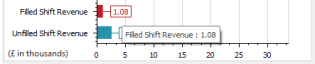
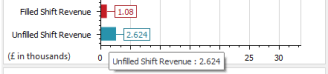
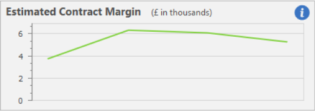
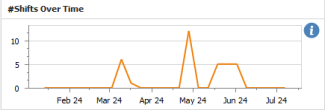
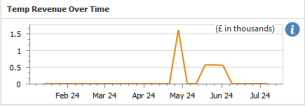
Estimated Perm Fee / Cont Margin / Temp Revenue Chart displays:
Actual Permanent and Fixed Term fees and Contract margins for placements which have started. Forecast Permanent and Fixed Term fees and Contract margins for placements which are offer accepted, awaiting confirmation or confirmed but not yet started. Pipeline Permanent and Fixed Term fees and Contract margins for unfilled current jobs Filled Shift Revenue Temp placement revenue for shifts of any status or confirmed onward as per the setting in the Admin / Target screen.. Unfilled Shift Revenue Temp placement revenue for unfilled job shifts . If a shift has 2 unfilled places this counts as 2 shifts Note - Fixed Term fees are included in the Contract charts Hover Tooltip displays Target information if set.
|
|||||||||||||||||||||||||||||||||||||||
Perm / Fixed Term / Contract Estimated Calculations:
Perm & Fixed Term Fees
Contract Margin
Calculating Contract Margin using Profit Per and Hours Per value
Calculations:
|
||||||||||||||||||||||||||||||||||||||||
|
Temp Filled shift revenue
|
|
Temp Unfilled Shift Revenue
|
|
|
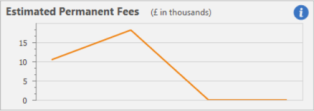
Estimated Permanent Fees displays:Fee value for Permanent placements which have started. Hover Tooltip displays Target information. |
|
|
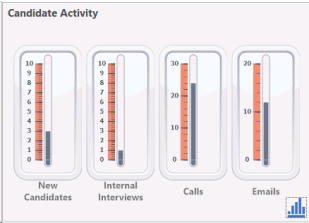
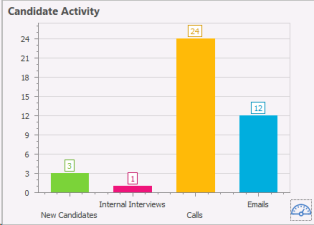
Candidate Activity displays:Selection of Candidate related activities
Hover Tooltip displays Target information
New Candidates: Includes any candidates added to the system manually or via iCapture, it does not include candidates that have been updated Internal Interviews:Includes any internal interviews candidates have been sent invitations Calls:Includes Phone event logs logged against candidate records Emails:Includes Emails sent to candidates via the database or from Outlook (if exchange sync has been setup for the user) |


|
|
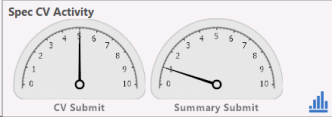
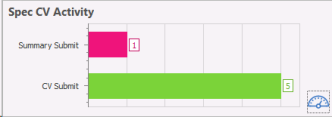
Spec CV Activity displays:Number of CV and Summary Submittals with target marked as an arrow
Hover Tooltip displays Target information |


|
|
Target Ratios displays:Selection of activities and related ratios |
|
|
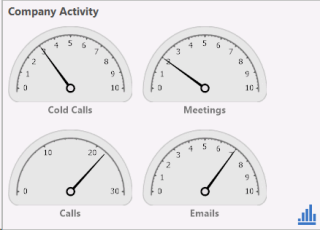
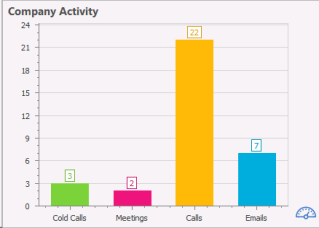
Company Activity displays:Selection of company related activities with target marked as an arrow and the option to switch from Chart view to gauge view using the graph button
Hover Tooltip displays Target information
Cold Calls: Includes all event logs, logged with the action "Cold Call" Meetings: Includes all "Client Visits" setup with a Company / Location / Contacts Calls: Includes all Phone event logged against a Company / Location / Contact Emails: Includes all emails sent to Companies / Locations / Contacts via the database or from Outlook (if exchange sync has been setup for the user) |


|
|
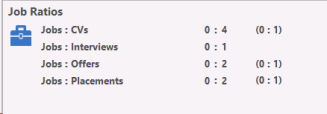
Job Ratios displays:Selection of Job related activities and ratios. |
|
|
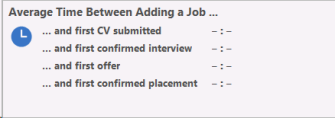
Average Time Between Adding a Job displays:The number of days between adding a Job and a selection of Job related activities. |
|
|
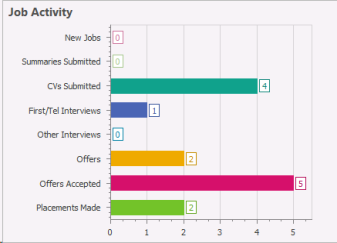
Job Activity displays:A selection of Job activities with target line clearly marked and total number displayed per activity. Hover Tooltip displays Target information |
|
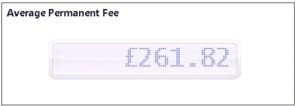
Average Permanent Fee displays:The average value per Perm Placement. |
|
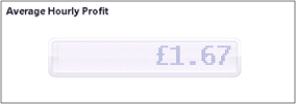
Average Hourly Profit displays:The average hourly value per Contract Placement. |
|
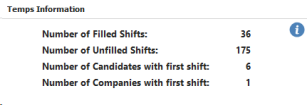
Temps InformationThe widget shows 4 statistics each with a name and a number Number of Filled Shifts
Number of Unfilled Shifts
Candidates with first shift
Companies with first shift
|
The Dashboard User options can be found via the Application Menu, User Options. Click on the Dashboard tab to display a selection of Dashboard configuration choices.
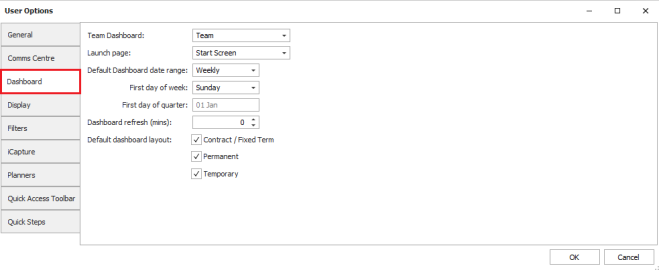
See User Options section for more details

If you require further assistance please contact Ikiru People using the details published on www.ikirupeople.com
Visit our Customer Portal at https://portal.ikirupeople.com/ for future events and clinics.
If you would like to make suggestions or have found any errors with this Help section please contact our Support team.
Version 4.87
Voyager Software is a brand of Ikiru People Ltd, a subsidiary of Dillistone Group Plc. The group is a leading global provider of software and services that enable recruitment agencies and in-house recruiters to better manage their selection process and address the training needs of individuals. Across its brands – which include Voyager Software (recruitment software UK & Australia), Dillistone FileFinder executive search software, GatedTalent, the global database of the world’s leading executives, Talentis.Global – the next generation of recruitment software and also ISV.Online, provider of online pre-employment skills testing and training tools. Dillistone Group serves thousands of clients worldwide. Ikiru People Ltd: Registration Number 02043300. Registered in England & Wales.
 |  |  |  |